Whatever you're investing for, there's a way to integrate ESG
Share
There are several different ways to integrate ESG in your portfolio. Choosing one depends on your conviction, your mandate or regulatory commitments, and the role you want ESG to play. With more options than ever before, this is a great time to review the core of your portfolio and consider an ESG makeover.
2022 has been a year of volatility, return dispersion and two-way flows. Yet it’s also been the second best year on record for ESG ETF and climate ETF flows.
These asset flows—despite everything going on in the world—reflect what we’re hearing from our clients. ESG is now an integral part of the investment process, and we’ve been receiving many more requests for ESG analysis and solutions as a result.
It’s not just our clients, either. In a 2021 survey, 79% of investors described ESG risks as an important factor in their investment decision-making process, while 75% agreed companies should address ESG issues, even if it reduced their short-term profitability1.
A different survey from this year, which focused on ETFs, found that more than 70% of investors invest in ESG and sustainable ETFs for societal reasons or to match their convictions. A more important driver in 2022 – from about 24% to 40% – was compliance with regulatory requirements2.
The good news is there are now a wide range of ESG ETFs available for investors, making it simpler to integrate ESG successfully in portfolios than ever before.
It all starts with making sense of the options on offer and what they would mean for a portfolio’s characteristics. Let’s start with a few signposts to help you navigate the world of ESG.
How to navigate ESG products
Amundi ETF has a very large range of responsible ETFs, with over €44bn in assets under management3. Our clients have varied needs, so our goal has been to create ETFs that can solve those different needs – providing an appropriate response to a specific ESG challenge.
Here’s how we break down our responsible investing range.
Type #1: ESG integration
Investment solutions with broad ESG considerations are what we call SRI or ESG. There are different ‘flavours’ of ESG integration depending on the intensity of the filtering of the investment universe.
Example indices: MSCI Europe ESG broad CTB, S&P 500 ESG, MSCI World SRI PAB
Type #2: Climate
What we call “climate ETFs” are Net-Zero-targeting funds that align with the minimum criteria stipulated by the European Commission to be classified as either a climate-transition benchmark (CTB) or the more ambitious Paris-aligned benchmark (PAB).
Example indices: MSCI Europe Climate Change CTB, S&P US 500 PAB
Type #3: ESG screening
It’s also possible to add ESG screening to non-ESG-specific ETFs. This would improve a portfolio’s ESG scores, exclude certain business activities from it, and generally create a more sustainable investment profile.
Example indices:MSCI New Energy ESG Filtered, MSCI Water ESG Filtered
It’s important to remember here that rising up the scale of ESG intensity always involves restrictions on the parent universe.
A strategy limited to excluding only a few key sectors will likely demonstrate performance very much in line with its reference index. Meanwhile, a strategy that screens out a large number of sectors, implements a 50% immediate decarbonisation, and won’t hold any company with an ESG rating below A (such as in the SRI PAB Index methodology), will necessarily deviate more from that reference index over time.
This deviation from a benchmark is known as tracking error or TE.
Ultimately, it’s not as simple as ‘ESG’ and ‘non ESG’ – investors can choose where they sit on the ESG spectrum. The trade-off for moving along it and therefore taking on more tracking error is increased ESG score, decreased carbon intensity, and usually some other changes in portfolio characteristics.
How increasing ESG intensity results in different TE profiles
Example: MSCI World ESG indices vs parent MSCI World Index
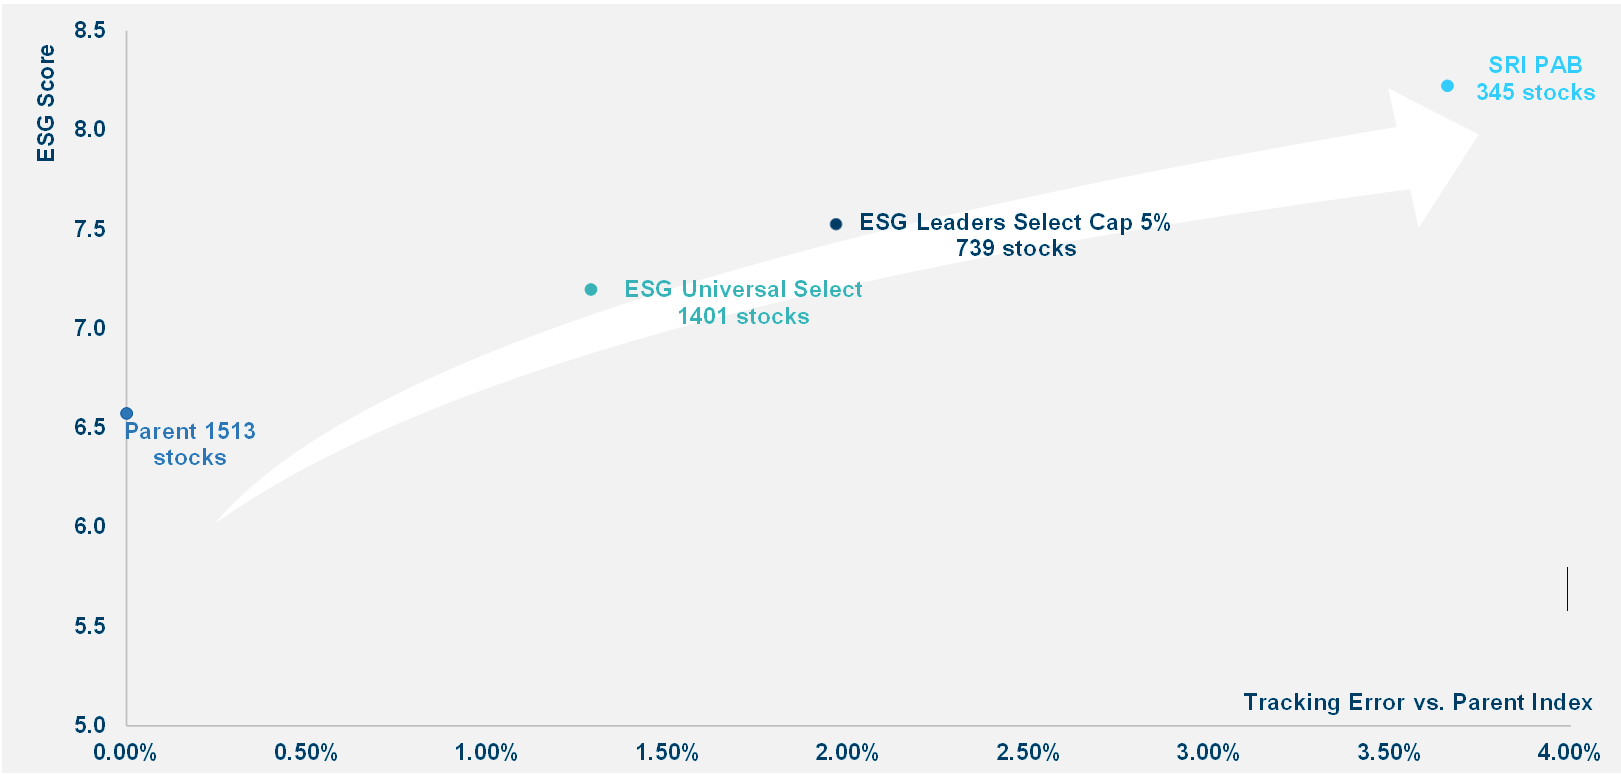
Source: MSCI as of June 2022. ESG scores are on a 0-10 scale, with 10 being the highest.
Tracking error is lower than you might expect
While increasing ESG intensity tends to increase the deviation from a given benchmark, the deviation is minimal across the ESG indices we’ve looked at.
In fact, even at the ‘SRI PAB end’ of the spectrum, which comes with ‘best in class’ screening and several layers of exclusions, there’s still a high correlation to the benchmark.
Overall, our analysis found a correlation of over 95% (0.95) between ESG equity indices and their respective benchmarks. This indicates that whichever solution or region you choose for implementing ESG, you still receive performance very much in line with the benchmark. There will be differences, of course – otherwise there would be no point in implementing it – but the key exposure will remain very similar.
In fixed income, the correlation is even closer. In ESG credit, for example, between 31 December 2020 and 30 September 2022 we found tracking error of just 14-40 basis points across EUR and USD credit exposures4.
If we bring this together in an illustrative portfolio, we can see this limited tracking error in action. Let’s consider a balanced 60/40 portfolio, with 36% MSCI USA, 12% MSCI Europe, 12% MSCI Japan for its equity component, alongside 40% Bloomberg Euro Aggregate for bonds.
Our analysis shows that switching the equity portion of this portfolio to the equivalent broad CTB indices, and the bond portion to its SRI equivalent, results in a 1Y tracking error of just 0.55, while delivering a 27% reduction in carbon intensity and a nearly 7% increase in ESG score.
For an even higher conviction investor, the exercise can be repeated with the more ‘ESG intense’ SRI PAB indices. There we find a 1Y TE of 2.08, which is still relatively modest, for a very significant 40% reduction in carbon footprint, and a 15% increase in ESG score.
This is just a snapshot from our research, but the takeaway is clear: ESG indices demonstrate a very strong and very high correlation with the parent indices, while delivering a meaningful improvement in ESG scores and carbon intensity.
There is always an element of relative risk in the ESG process. As your ESG intensity rises, you will deviate more from the benchmark. That’s an inherent part of the process. But our analysis shows this tracking error is well within the realms of acceptability, even for the highest conviction ESG switches.
Taken together, this is a great time to be an ESG investor. Whatever your goals, constraints and preferences, you have more access to a variety of ETFs than ever before.
Here at Amundi, it’s our job to make any transition as smooth and transparent as possible, and help you on your ESG journey. Let us know if you’d like any further information or a deeper dive on your options.
1. PwC, Global Investor Survey 2021
2. TrackInsight, Global ETF Survey 2022
3. Amundi ETF, ESG ETF assets under management, 30 September 2022
4. Amundi ETF analysis, November 2022
Knowing your risk
It is important for potential investors to evaluate the risks described below and in the fund’s Key Investor Information Document (“KIID”) and prospectus available on our websites www.amundietf.com (as the case may be).
CAPITAL AT RISK - ETFs are tracking instruments. Their risk profile is similar to a direct investment in the underlying index. Investors’ capital is fully at risk and investors may not get back the amount originally invested.
UNDERLYING RISK - The underlying index of an ETF may be complex and volatile. For example, ETFs exposed to Emerging Markets carry a greater risk of potential loss than investment in Developed Markets as they are exposed to a wide range of unpredictable Emerging Market risks.
REPLICATION RISK - The fund’s objectives might not be reached due to unexpected events on the underlying markets which will impact the index calculation and the efficient fund replication.
COUNTERPARTY RISK - Investors are exposed to risks resulting from the use of an OTC swap (over-the-counter) or securities lending with the respective counterparty(-ies). Counterparty(-ies) are credit institution(s) whose name(s) can be found on the fund’s website amundietf.com or lyxoretf.com. In line with the UCITS guidelines, the exposure to the counterparty cannot exceed 10% of the total assets of the fund.
CURRENCY RISK – An ETF may be exposed to currency risk if the ETF is denominated in a currency different to that of the underlying index securities it is tracking. This means that exchange rate fluctuations could have a negative or positive effect on returns.
LIQUIDITY RISK – There is a risk associated with the markets to which the ETF is exposed. The price and the value of investments are linked to the liquidity risk of the underlying index components. Investments can go up or down. In addition, on the secondary market liquidity is provided by registered market makers on the respective stock exchange where the ETF is listed. On exchange, liquidity may be limited as a result of a suspension in the underlying market represented by the underlying index tracked by the ETF; a failure in the systems of one of the relevant stock exchanges, or other market-maker systems; or an abnormal trading situation or event.
VOLATILITY RISK – The ETF is exposed to changes in the volatility patterns of the underlying index relevant markets. The ETF value can change rapidly and unpredictably, and potentially move in a large magnitude, up or down.
CONCENTRATION RISK – Thematic ETFs select stocks or bonds for their portfolio from the original benchmark index. Where selection rules are extensive, it can lead to a more concentrated portfolio where risk is spread over fewer stocks than the original benchmark.
Important Information
This material is solely for the attention of professional and eligible counterparties, as defined in Directive MIF 2014/65/UE of the European Parliament acting solely and exclusively on their own account. It is not directed at retail clients. In Switzerland, it is solely for the attention of qualified investors within the meaning of Article 10 paragraph 3 a), b), c) and d) of the Federal Act on Collective Investment Scheme of June 23, 2006. This information is not for distribution and does not constitute an offer to sell or the solicitation of any offer to buy any securities or services in the United States or in any of its territories or possessions subject to its jurisdiction to or for the benefit of any U.S. Person (as defined in the prospectus of the Funds or in the legal mentions section on www.amundi.com and www.amundietf.com. The Funds have not been registered in the United States under the Investment Company Act of 1940 and units/shares of the Funds are not registered in the United States under the Securities Act of 1933. The information and forecasts are inevitably partial, provided on the basis of market data observed at a particular moment, and are subject to change. This document may contain information from third parties that do not belong to Amundi (“Third Party Content”). Third Party Content is provided for information purposes only (for illustration, comparison, etc.). Any opinion or recommendation contained in Third Party Content derives exclusively from these third parties and in no circumstances shall the reproduction or use of those opinions and commendation by Amundi AM constitute an implicit or explicit approval by Amundi AM. Information reputed exact as of September 2022.
Reproduction prohibited without the written consent of the Management Company. Amundi ETF designates the ETF business of Amundi Asset Management. This Document was not reviewed/stamped/approved by any Financial Authority. Amundi ETF funds are neither sponsored, approved nor sold by the index providers. The index providers do not make any declaration as to the suitability of any investment. A full description of the indices is available from the providers. This document is being issued inside the United Kingdom by Amundi which is authorised by the Autorité des marchés financiers and subject to limited regulation by the Financial Conduct Authority (“FCA”). Details about the extent of regulation by the FCA are available on request. This document is only directed at persons who are professional clients or eligible counterparties for the purposes of the FCA’s Conduct of Business Sourcebook. The investments described herein are only available to such persons and this document must not be relied or acted upon by any other persons. This document may not be distributed to any person other than the person to whom it is addressed without the express prior consent of Amundi.
Amundi Asset Management, French “Société par Actions Simplifiée” - SAS with capital of €1,143,615,555 - Portfolio Management Company approved by the AMF (French securities regulator) under no. GP 04000036 - Registered office: 91-93 boulevard Pasteur, 75015 Paris - France. 437 574 452 RCS Paris.